Earthquakes
Earthquakes in the Pacific Northwest
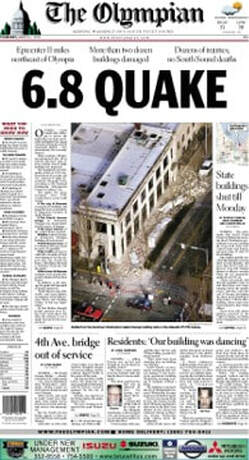
The Puget Sound region of Washington state was jolted from its morning routine at 10:55 a.m. on Wednesday, February 28th, 2001 by a magnitude 6.8 earthquake, centered just 11 miles northeast of Olympia. In Seattle, Tacoma, and other communities across the region, the ground shook for up to 40 seconds, rattling buildings and sending some occupants into a panic.
This event, named the Nisqually earthquake, was actually slightly larger than the Northridge, California 6.7 magnitude earthquake of January 17, 1994. Yet, based on preliminary reports, it appears that losses in the Nisqually earthquake will total only $2 billion while the Northridge earthquake was the costliest disaster in U.S. history with an economic loss of $40 billion. Likewise, only one death, a heart attack victim, was reported in the Seattle area, while 57 people lost their lives in the Northridge earthquake.
Why was the damage in the Washington so much less than the damage caused by the 1994 Northridge earthquake, when their magnitudes were so similar-- 6.8 vs. 6.7?
Was it because the Seattle area was so much better prepared for earthquakes than the Los Angeles area? Or was it due to differences in the earthquakes themselves?
Major difference #1: Location
Much of the difference in the total damage caused by the Nisqually and the Northridge earthquakes can be attributed to the location of each – and not just the epicenter (a measurement of latitude and longitude), but the depth as well. The Northridge earthquake occurred 11 miles below the earth’s surface, deep for a California earthquake, but considered shallow by comparison with other regions. The Nisqually earthquake occurred 33 miles below the earth’s surface. Obviously, a town 11 miles away from the epicenter of an earthquake would suffer greater losses than a town located 33 miles away. That may seem to be an obvious statement, but earthquake depth is often entirely overlooked in reports of an earthquake's effects.
Major difference #2: Tectonics
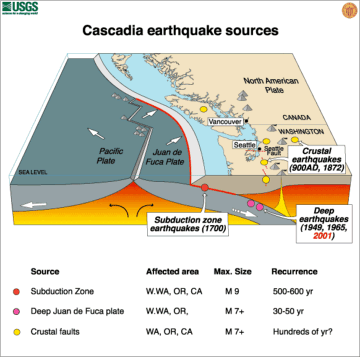
The fact that western Washington State can experience such deep earthquakes, while southern California cannot, is the direct result of the tectonic environment found in each region. In the Pacific Northwest the oceanic Juan de Fuca plate subducts beneath, or pushes against the continental North American plate in a northeasterly direction at the rate of 1 to 2 inches per year. This collision of plates creates stresses that cause extension, or the stretching and pulling apart of the earth’s crust within the Juan de Fuca plate, where the Nisqually earthquake occurred.
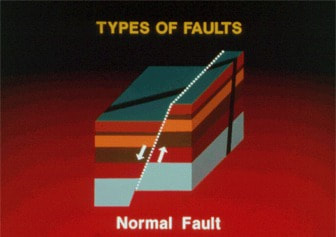
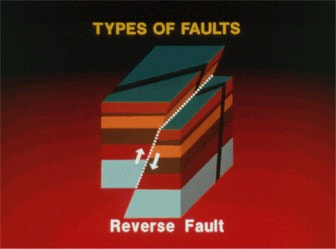
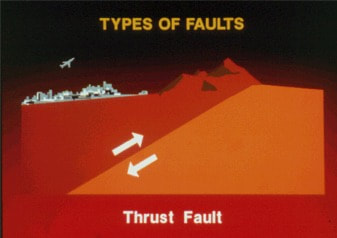
The fault slip, or fault movement, for the Nisqually earthquake was what geologists call "normal," meaning that the ground above the tilted fault plane moved downward relative to the material beneath the plane moving upward.The fault associated with the 1994 Northridge earthquake is probably part of the Oak Ridge fault system and has been called by geologists a blind thrust fault, or a shallow-dipping reverse fault that terminates before it reaches the surface. In other words, it moves much like an ocean wave that crests but stops abruptly before it breaks. This type of fault, therefore, may produce uplift, but never any clear surface rupture.
Major difference #3: Ground Shaking
While an earthquake has one magnitude and one epicenter, it produces a range of ground shaking levels at sites throughout the region depending on distance from the earthquake, the rock and soil conditions at sites, and variations in the propagation of seismic waves from the earthquake due to complexities in the structure of the Earth's crust. Ground-motion data from seismometers across Washington State was processed by the U.S. Geological Survey to create a shaking intensity map. A comparison of this map with the shaking intensity map for the Northridge earthquake showed that the total area of potentially damaging shaking was fairly similar for the two events, but the area of high-intensity shaking for the Northridge earthquake was essentially absent for the Nisqually event.
This difference is primarily due to the hypocentral depths of the two earthquakes. Someone standing roughly 28 miles away from the epicenter of the Northridge earthquake would have experienced similar ground shaking to someone standing at the very epicenter of the Nisqually earthquake. The shaking intensity maps for both quakes verify this conclusion. Ground shaking intensities were far greater at the epicenter and nearby areas of the Northridge earthquake because the source of the earthquake was but 11 miles below the earth's surface as opposed to the 33 mile depth of the Nisqually quake.
"Did You Feel It?" reports from the Nisqually earthquake showed that most residents throughout the region experienced "very strong" shaking (characteristics of Intensity rating VII) but no reports of severe or violent shaking (characteristics of Intensity rating VIII or IX), even in those places nearest the epicenter. Reports from the Northridge earthquake showed that residents in the epicentral region (and some areas farther afield) reported severe, even violent, shaking (Intensity VIII or IX), while communities farther away experienced more moderate intensities.
Major difference #4: After Shocks
Another striking difference between these two earthquakes became apparent soon after the Nisqually earthquake struck. Whereas the Northridge earthquake was followed by hundreds of smaller earthquakes, or aftershocks, within the first week, one week after the Nisqually earthquake only two aftershocks had been recorded. The largest of the aftershocks to the Nisqually earthquake was a magnitude 3.4 jolt that struck about 14 hours after the magnitude 6.8 mainshock. The largest Northridge aftershock, by comparison, measured magnitude 5.9, and five other first-week aftershocks exceeded magnitude 5. Moderate aftershocks are capable of causing further damage to weakened structures, so the lack of significant aftershocks was a factor in mitigating the total loss caused by the Nisqually earthquake.
Conclusion
As it turns out, the results and damaging affects of each earthquake came as no real surprise to seismologists. Previous large earthquakes in Washington at similar depths in the subducting Juan de Fuca plate, in 1949 and 1965, were also followed by very limited aftershock activity, so the Nisqually aftershock sequence, or lack thereof, was really quite typical. Likewise, the Northridge aftershock sequence was in no way unusual compared to the average activity of southern California aftershock sequences. Thus, the obvious differences between these two major earthquakes reflects the underlying difference in the source of each -- one in the subducting oceanic plate beneath western Washington, the other in the comparatively shallow, brittle crust of southern California.
[Earthquake comparison information provided by
the Southern California Earthquake Center (SCEC)]
Summary of Earthquake Activity in Washington
The Seattle area has experienced eleven earthquakes a magnitude of 5.0 or greater since 1904.The 1995 (M=5.0) and 1996 (M=5.3) events were shallow crustal events.
The three most recent damaging earthquakes in Washington occurred in 1965 (M=6.5), 1949 (M=7.1) and 2001 (M=6.8). All three were roughly 40 miles deep and in the oceanic plate where it lies beneath the continent.
The largest historic earthquake in either Washington or Oregon occurred in 1872 in the Northern Cascades. This "shallow" earthquake had an estimated magnitude of 7.4 and was followed by many aftershocks. It was probably at a depth of ten miles or less within the continental crust.
In 1993, a magnitude 5.6 earthquake in the Willamette Valley caused 28 million in damages.
Although no large earthquakes have happened along the offshore Cascadia Subduction Zone since our historical records began in 1790, similar subduction zones worldwide do produce "great" earthquakes of a magnitude 8.0 or larger. These occur because the oceanic crust "sticks" as it is being pushed beneath the continent rather than sliding smoothly. Over hundreds of years, large stresses build that are released suddenly in great earthquakes. Such earthquakes typically have a minute or more of strong ground shaking and are quickly followed by damaging tsunamis and numerous large aftershocks. However, it does appear from the comparative information above, that the damaging effects of such earthquakes is directly related to the depth at which they occur.
Plate Tectonics
Understanding Plate Tectonics
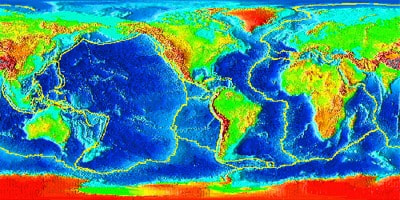
The world's earthquakes are not randomly distributed over the Earth's surface. They tend to be concentrated in narrow zones. Why is this? And why are volcanoes and mountain ranges also found in these zones, too? An explanation is to be found in plate tectonics, a concept which has revolutionized thinking in the Earth's sciences in the last 10 years. The theory of plate tectonics combines many of the ideas about continental drift (originally proposed in 1912 by Alfred Wegener in Germany) and sea-floor spreading (suggested originally by Harry Hess of Princeton University).
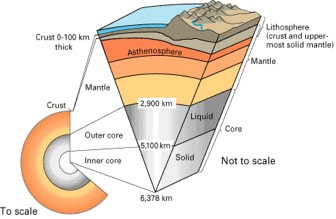
Plate tectonics tells us that the Earth's rigid outer shell (lithosphere) is broken into a mosaic of oceanic and continental plates which can slide over the plastic asthenosphere, which is the uppermost layer of the mantle. The plates are in constant motion. Where they interact, along their margins, important geological processes take place, such as the formation of mountain belts, earthquakes, and volcanoes.
Plate tectonics tells us that the Earth's rigid outer shell (lithosphere) is broken into a mosaic of oceanic and continental plates which can slide over the plastic asthenosphere, which is the uppermost layer of the mantle. The plates are in constant motion. Where they interact, along their margins, important geological processes take place, such as the formation of mountain belts, earthquakes, and volcanoes.
One of the keys to plate tectonics was the discovery that the Earth's magnetic field has reversed its polarity 170 times in the last 80 million years. As new basaltic material is squeezed up into the mid-ocean cracks and solidifies, it is magnetized according to the polarity of the Earth's magnetic field. If the field reverses its polarity, the strip of new material is magnetized in an opposite sense. As the oceanic floor continues to spread, the new strips of rock are carried away on either side like a conveyer belt.
Using these magnetic strips as evidence of movement, it became obvious that the Earth's surface consisted of a mosaic of crustal plates that were continually jostling one another. If the Earth was not to be blown up like a balloon by the continual influx of new volcanic material at the ocean ridges, then old crust must be destroyed at the same rate where plates collide. The required balance occurs when plates collide, and one plate is forced under the other to be consumed deep in the mantle.
We now know that there are seven major crustal plates, subdivided into a number of smaller plates. They are about 80 kilometers thick, all in constant motion relative to one another, at rates varying from 10 to 130 millimeters per year. Their pattern is neither symmetrical nor simple. As we learn more and more about the major plates, we find that many complicated and intricate maneuvers are taking place. We learn, too, that most of the geological action - mountains, rift valleys, volcanoes, earthquakes, faulting - is due to different types of interaction at plate boundaries.
How are earthquakes connected with plate tectonics? In 1969, Muawia Barazangi and James Dorman published the locations of all earthquakes that occurred from 1961 to 1967. Most of the earthquakes are confined to narrow belts and these belts define the boundaries of the plates. The interiors of the plates themselves are largely free of large earthquakes, that is, they are aseismic. There are notable exceptions to this. An obvious exception is the 1811-1812 earthquakes at New Madrid, Missouri. Another is the 1886 earthquake at Charleston, South Carolina. As yet there is no satisfactory plate tectonic explanation for these isolated events; consequently, we will have to find alternative mechanisms.
Plate tectonics confirms that there are four types of seismic zones. The first follows the line of mid-ocean ridges. Activity is low, and it occurs at very shallow depths. The second type of earthquake associated with plate tectonics is the shallow-focus event unaccompanied by volcanic activity. The San Andreas fault is a good example of this, so is the Anatolian fault in Northern Turkey. In these faults, two mature plates are scraping by one another. The friction between the plates can be so great that very large strains can build up before they are periodically relieved by large earthquakes. The third type of earthquake is related to the collision of oceanic and continental plates. One plate is thrust or subducted under the other plate so that a deep ocean trench is produced. This type of earthquake can be shallow, intermediate, or deep, according to its location on the downgoing lithospheric slab. Such inclined planes of earthquakes are known as Benioff zones. The fourth type of seismic zone occurs along the boundaries of continental plates. Within this zone, shallow earthquakes are associated with high mountain ranges where intense compression is taking place.
In summary, plate tectonics is a blunt, but, nevertheless, strong tool in earthquake prediction. It tells us where 90 percent of the Earth's major earthquakes are likely to occur. It cannot tell us much about exactly when they will occur. For that, we must study in detail the plate boundaries themselves. Perhaps the most important role of plate tectonics is that it is a guide to the use of finer techniques for earthquake prediction.
Faults
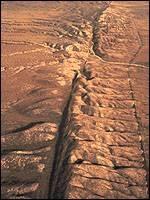
Most earthquake faults, unlike California's San Andreas fault, are too deep for seismologists to watch.
Types of Faults
Types of Faults
A fault is a fracture or zone of fractures between two blocks of rock. Faults allow the blocks to move relative to each other. This movement may occur rapidly, in the form of an earthquake - or may occur slowly, in the form of creep. Faults may range in length from a few millimeters to thousands of kilometers. Most faults produce repeated displacements over geologic time. During an earthquake, the rock on one side of the fault suddenly slips with respect to the other. The fault surface can be horizontal or vertical or some arbitrary angle in between.
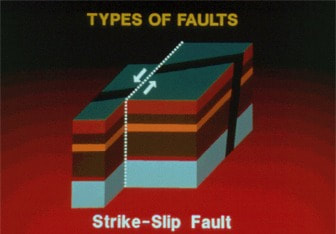
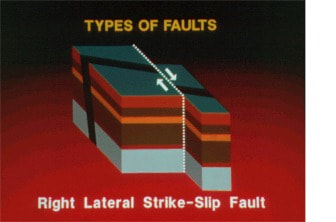
Earth scientists use the angle of the fault with respect to the surface (known as the dip) and the direction of slip along the fault to classify faults. Faults that move along the direction of the dip plane are dip-slip faults and described as either normal or reverse, depending on their motion. Faults that move horizontally are known as strike-slip faults and are classified as either right-lateral or left-lateral. Faults that show both dip-slip and strike-slip motion are known as oblique-slip faults.
Earth scientists use the angle of the fault with respect to the surface (known as the dip) and the direction of slip along the fault to classify faults. Faults that move along the direction of the dip plane are dip-slip faults and described as either normal or reverse, depending on their motion. Faults that move horizontally are known as strike-slip faults and are classified as either right-lateral or left-lateral. Faults that show both dip-slip and strike-slip motion are known as oblique-slip faults.
A normal fault is a dip-slip fault in which the block above the fault has moved downward relative to the block below. This type of faulting occurs in response to extension and is often observed in the Western United States Basin and Range Province and along oceanic ridge systems.
A thrust fault is a dip-slip fault in which the upper block, above the fault plane, moves up and over the lower block. This type of faulting is common in areas of compression, such as regions where one plate is being subducted under another as in Japan and along the Washington coast. When the dip angle is shallow, a reverse fault is often described as a thrust fault.
A strike-slip fault is a fault on which the two blocks slide past one another. These faults are identified as either right-lateral or left lateral depending on whether the displacement of the far block is to the right or the left when viewed from either side. The San Andreas Fault in California is an example of a right lateral fault.
Magnitude
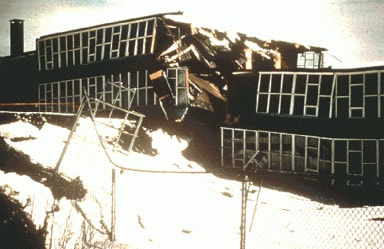
Earthquake of March 28, 1964, Prince William Sound, Alaska. The magnitude 8.5 earthquake killed 131 people and caused 538 million in property damage. An area consisting of 120,700 km2 was shaken with damaging intensity.
Understanding Magnitude
Earthquakes are recorded by a seismographic network. Each seismic station in the network measures the movement of the ground at their site. When an earthquake occurs, it releases energy in the form of waves that radiate from the earthquake source in all directions. The different types of energy waves shake the ground in different ways and also travel through the earth at different velocities.
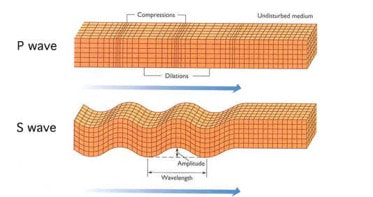
The fastest wave, and therefore the first to arrive at a given location, is called the P wave. The P wave, or compressional wave, alternately compresses and expands material in the same direction it is traveling. The S wave is slower than the P wave and arrives next, shaking the ground up and down and back and forth perpendicular to the direction it is traveling. Surface waves follow the P and S waves.
There are many ways to measure different aspects of an earthquake. Magnitude is the most common measure of an earthquake's size. It is a measure of the size of the earthquake source and is the same number no matter where you are or what the shaking feels like. The Richter scale measures the largest wiggle on the recording, but other magnitude scales measure different parts of the earthquake.
Magnitude scales are logarithmic. That is, every time the magnitude goes up by one unit, the amplitude of waves recorded by a seismograph increases ten times. Generally, earthquakes must attain a 5.5 or greater magnitude before significant damage occurs near the source of an earthquake.
Earthquake size, as measured by the Richter Scale is a well known, but not well understood, concept. The idea of a logarithmic earthquake magnitude scale was first developed by Charles Richter in the 1930's for measuring the size of earthquakes occurring in southern California using relatively high-frequency data from nearby seismograph stations. As more seismograph stations were installed around the world, it became apparent that the method developed by Richter was strictly valid only for certain frequency and distance ranges. In order to take advantage of the growing number of globally distributed seismograph stations, new magnitude scales that are an extension of Richter's original idea were developed. Each being valid for a particular frequency range and type of seismic signal. Because of the limitations of all of the magnitude scales, a new, more uniformly applicable extension of the magnitude scale, known as moment magnitude, or Mw, was developed. In particular, for very large earthquakes moment magnitude gives the most reliable estimate of earthquake size. New techniques that take advantage of modern telecommunications have recently been implemented, allowing reporting agencies to obtain rapid estimates of moment magnitude for significant earthquakes.</p align=">
Earthquakes release a tremendous amount of energy, which is why they can be so destructive. The table below shows magnitudes with the approximate amount of TNT needed to release the same amount of energy.
Magnitude-------------Approximate TNT Energy
4.0------------------------6 tons
5.0------------------------199 tons
6.0------------------------6,270 tons
7.0------------------------199,000 tons
8.0------------------------6,270,000 tons
9.0------------------------99,000,000 tons
Generally speaking, however, based on magnitude, earthquakes can be classified as follows
Great earthquake = M > 8
Major earthquake = 7 < M < 7.9
Strong earthquake = 6 < M < 6.9
Moderate earthquake = 5 < M < 5.9
Light earthquake = 4 < M < 4.9
Minor earthquake = 3 < M < 3.9
Intensity
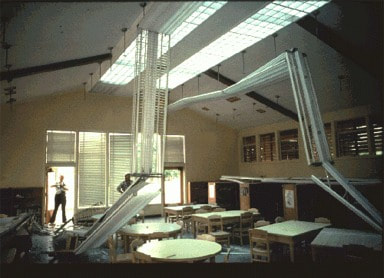
Earthquake of May 2, 1983, Coalinga, California, USA. Affected Area: 205,000 km2; Damage: 31 million. The most serious damage occurred in the eight-block downtown commercial district, but residents were also heavily damaged. More then 800 single-family houses were destroyed or incurred major damage. The majority of the 94 injuries occurred in residential sections of the city.
Understanding Intensity
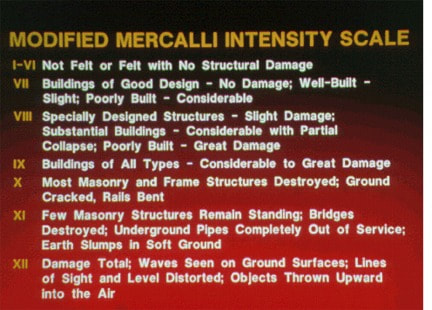
Intensity is a measure of the shaking and damage caused by the earthquake, and this value changes from location to location. Intensity levels are expressed numerically according to observation of damage done to structures, changes in the earth's surface and subjective reports by people who experienced the shaking.
The Mercalli Scale is based on observable earthquake damage. From a scientific standpoint, the Richter scale is based on seismic records while the Mercalli scale is based on observable data which can be subjective. Thus, the Richter scale is considered scientifically more objective and therefore more accurate. For example a level I-V on the Mercalli scale would represent a small amount of observable damage. At this level doors would rattle, dishes break and weak or poor plaster would crack. As the level rises toward the larger numbers, the amount of damage increases considerably. The top number, 12, represents total damage.
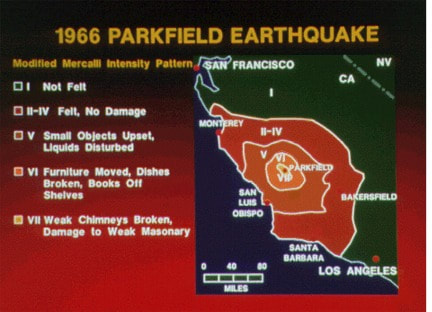
Following an earthquake, intensity maps are sometimes drawn. On these maps are isoseismals, or contour lines, that separate one level of shaking intensity from another. MMI shaking intensity VI is usually considered the threshold of shaking that produces damage to poorly constructed man-made structures. Major damage occurs at intensity levels VIII and above.
Epicenters
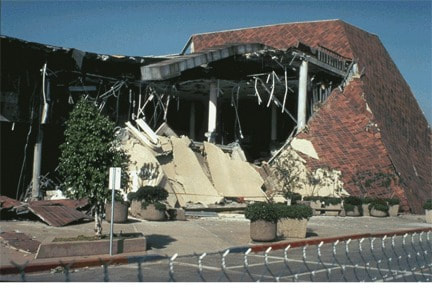
[At 4:31 A.M. (local time) on Monday, January 17, 1994, a magnitude 6.8 earthquake woke nearly everyone in southern California. The earthquake epicenter was beneath the San Fernando Valley, 20 miles west-northwest of downtown Los Angeles, near the community of Northridge. At the Northridge Fashion Center, near the earthquake epicenter, the second and third floors of Bullocks Department Store collapsed onto the bottom story.]
Locating Epicenters
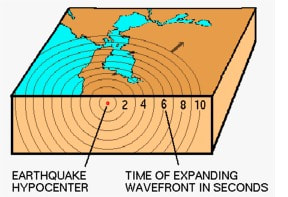
When an earthquake occurs, one of the first questions is "where was it?" The location may tell us what fault it was on and where damage (if any) most likely occurred. Unfortunately, the earth is not transparent and we can't just see or photograph the earthquake disturbance like meteorologists can photograph clouds. When an earthquake occurs, it generates an expanding wave-front from the earthquake hypocenter at a speed of several kilometers per second.
We observe earthquakes with a network of seismometers on the earth's surface. The ground motion at each seismometer is amplified and recorded electronically at a central recording site. As the wave-front expands from the earthquake, it reaches more distant seismic stations. When an earthquake occurs, we observe the times at which the wave-front passes each station. Determining the earthquake source is calculated from these wave arrival times.
The procedure is simple to state: 1. Guess a location, depth and origin time. 2. Compare the predicted arrival times of the wave from your guessed location with the observed times at each station. 3. Move the location a little in the direction that reduces the difference between the observed and calculated times. 4. Repeat this procedure, each time getting closer to the actual earthquake location and fitting the observed times a little better. 5. Quit when your adjustments have become small enough and when they fit to the observed wave arrival times close enough.
Mathematically, the problem is solved by setting up a system of linear equations, one for each station. The equations express the difference between the observed arrival times and those calculated from the previous (or initial) hypocenter, in terms of small steps in the 3 hypocentral coordinates and the origin time. We must also have a mathematical model of the crustal velocities (in kilometers per second) under the seismic network to calculate the travel times of waves from an earthquake at a given depth to a station at a given distance. The system of linear equations is solved by the method of least squares which minimizes the sum of the squares of the differences between the observed and calculated arrival times. The process begins with an initial guessed hypocenter, performs several hypocentral adjustments each found by a least squares solution to the equations, and iterates to a hypocenter that best fits the observed set of wave arrival times at the stations of the seismic network.
Mathematically, the problem is solved by setting up a system of linear equations, one for each station. The equations express the difference between the observed arrival times and those calculated from the previous (or initial) hypocenter, in terms of small steps in the 3 hypocentral coordinates and the origin time. We must also have a mathematical model of the crustal velocities (in kilometers per second) under the seismic network to calculate the travel times of waves from an earthquake at a given depth to a station at a given distance. The system of linear equations is solved by the method of least squares which minimizes the sum of the squares of the differences between the observed and calculated arrival times. The process begins with an initial guessed hypocenter, performs several hypocentral adjustments each found by a least squares solution to the equations, and iterates to a hypocenter that best fits the observed set of wave arrival times at the stations of the seismic network.
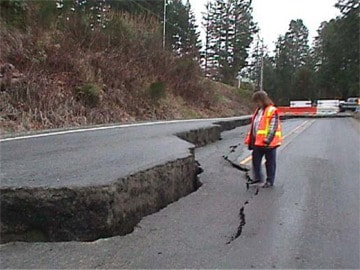 Nisqually Earthquake Damage on SR 302 -
South of Belfair, Washington (Photo by WSDOT)
Rupture Mechanics
Rupture Mechanics
Understanding Rupture Mechanics
Understanding Rupture Mechanics
Plate motion and rupture mechanics can be demonstrated diagramatically. Adjacent crustal plates or pieces of plates with little or no stress build-up may characterize an inactive fault, one with continuous creep or one in which energy has only recently been released in an earthquake.
Over time, ranging from decades to millennia, stress builds along the fault until it reaches a breaking point. Sudden slippage occurs as the stress is released, creating the ground motion of an earthquake.
Can the science of plate tectonics and rupture mechanics help in earthquake prediction? We have seen that earthquakes occur at the following three kinds of plate boundaries: ocean ridges where the plates are pulled apart, margins where the plates scrape past one another, and margins where one plate is thrust under the other. Thus, we can predict the general regions on the Earth's surface where we can expect large earthquakes in the future. We know that each year about 140 earthquakes of magnitude 6 or greater will occur within this area which is 10 percent of the Earth's surface.
But on a worldwide basis we cannot say with much accuracy when these events will occur. The reason is that the processes in plate tectonics have been going on for millions of years. Only by monitoring the stress and strain in small areas can we hope to predict when renewed activity in that part of the plate tectonics arena is likely to take place.
But on a worldwide basis we cannot say with much accuracy when these events will occur. The reason is that the processes in plate tectonics have been going on for millions of years. Only by monitoring the stress and strain in small areas can we hope to predict when renewed activity in that part of the plate tectonics arena is likely to take place.
